on
DataScience Security Networks
Compromised Network Traffic Analysis
On 8 January 2022, I downloaded this network traffic dataset from Kaggle. The dataset was originally from Professor Chiara Sabatti’s page, which used to be hosted under the subdomain owned by Stanford’s Department of Statistics. I decided to explore the dataset for a bit.
The Kaggle page with the dataset quotes Professor Sabatti’s paragraph on the dataset link on her page, as follows.
A ~500K CSV with summary of some real network traffic data from the past. The dataset has ~21K rows and covers 10 local workstation IPs over a three month period. Half of these local IPs were compromised at some point during this period and became members of various botnets. Can you discover when a compromise has occurred by a change in the pattern of communication?
I tried exploring the dataset and the data description to see if there’s anything I can find related to the question as phrased by Professor Sabatti, “Can you discover when a compromise has occurred by a change in the pattern of communication?”
The following fields are available in the dataset.
| Field | Description |
|---|---|
date |
Date string withyyyy-mm-dd format |
l_ipn |
Integer (0-9) representing a local machine’s IP address |
r_asn |
Integer representing a remote ISP with which the local machines were communicating with |
f |
Number of connections made from a local machine to a remote ISP on the day |
And the following dates are identified as the date of compromise of some of the machines in the dataset.
| Date | Compromised Machine(s) |
|---|---|
| 2006-08-24 | 1 |
| 2006-09-04 | 5 |
| 2006-09-18 | 4 |
| 2006-09-26 | 3, 6 |
Problem Definition
I think it’s a bit of a stretch to try and identify whether a machine is compromised or not on a certain day simply by relying on the information we have so far. We’re only told that the machines were a part of various botnets, but we have no information on the kinds of botnet they were. Other than the date when the compromises were detected on the machine, we were given practically zero information on the compromise and how it was detected.
Different malware may behave differently, so generalizing the problem into “the machines were compromised and turned into zombies for various botnets” isn’t enough for us. We can assume that we have the same malware on all of them, but the dates of compromise are quite far away between the machines. Only machines 3 and 6 are close enough and infected by the malware on the same day, but we don’t have the information if both machines are from the same network either.
Given the situation, it might be more reasonable for us to specifically inspect machines 1, 3, 4, 5, and 6 to look for possible clues that may indicate compromise on the date of detection based on the data we have. The indications of the compromise may differ from one machine with another because we don’t know if the method and the purpose of the compromise is the same for all machines. Because different attackers and different malware may behave differently and may attack for different goals, it’s safe to not assume the attackers and malware are the same for all machines.
Once we get the possible indications of compromise from our machines of interest, we can try to define a rule-based detection model to try and detect possible compromises from the same attackers or malware on the other machines.
The reason we’re resorting to rule-based detection, instead of building a statistical anomaly detection or classifier model in this case, is that we have relatively few information to work with. In the field of cybersecurity, rule-based detection is a sensible approach for situations where we don’t have enough data for generalizing across different cases but we know exactly what specific patterns the attackers we’re trying to defend against are exhibiting in one exact case.
Analysis
The date of detected compromise as follows, as mentioned earlier in this post.
| Date | Compromised Machine(s) |
|---|---|
| 2006-08-24 | 1 |
| 2006-09-04 | 5 |
| 2006-09-18 | 4 |
| 2006-09-26 | 3, 6 |
Connection Patterns
We’d like to see if there’s any changes in the machines’ daily connection pattern on their respective compromise dates.
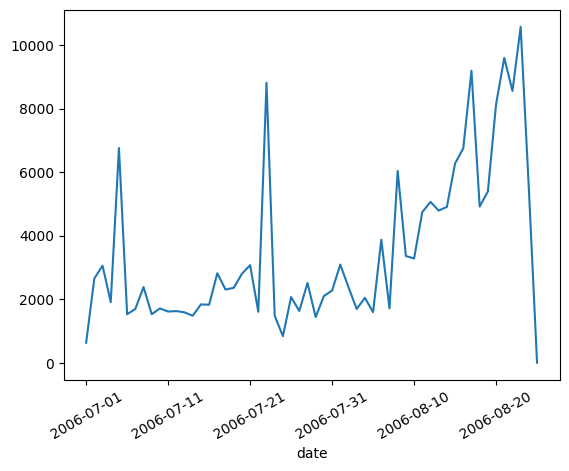
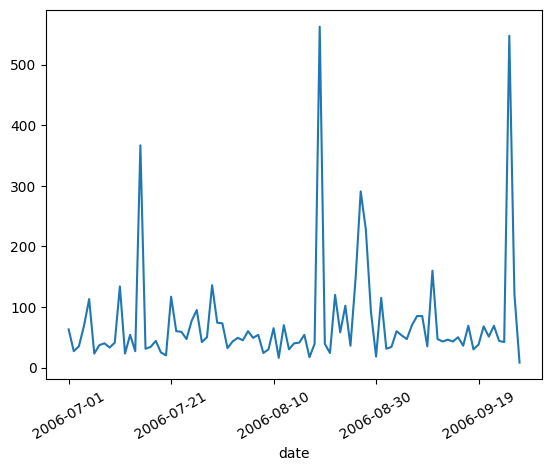
Machine 1 - Detected Compromise Date: 2006-08-24
The machine shows a spike in the number of connections made around the time of compromise, but the peak is actually on 2006-08-22 instead of on 2006-08-24 when the compromise is detected. On 2006-08-24, the number of connections made is lower.
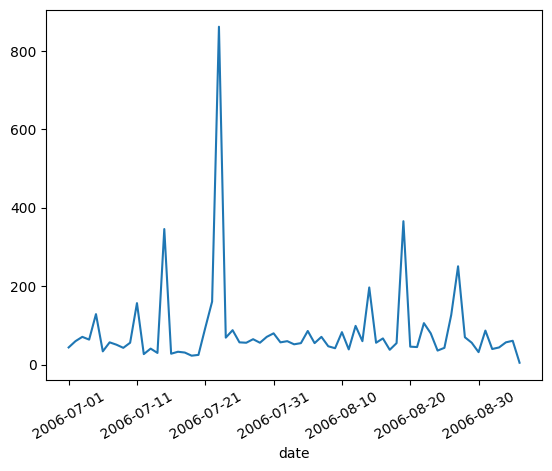
Machine 5 - Detected Compromise Date: 2006-09-04
The machine doesn’t show any significant difference in the number of connections made around the time of compromise.
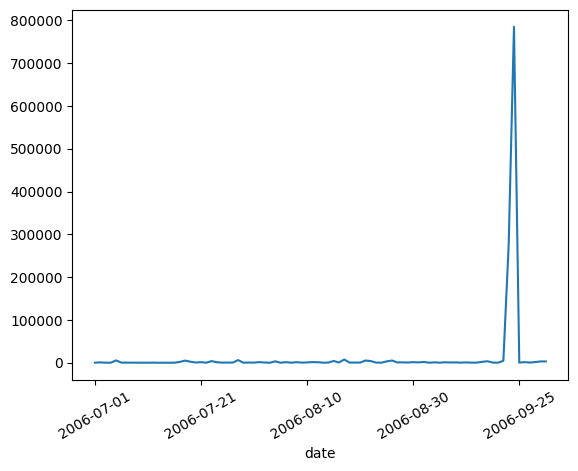
Machine 4 - Detected Compromise Date: 2006-09-18
We can see a huge spike in the number of connection made on 2006-09-18, which is the date the machine was identified as a compromised machine. Given the number of connections made on the day, the machine might be participating in a DDoS attack. But the number of connections started to spike on 2006-09-17, with the total of 275,140 connections a day before it peaked in 2006-09-17 with the total of 785,297 connections made in a day.
Machine 3 - Detected Compromise Date: 2006-09-26
We can see a spike around the time of compromise in the chart. The spike happens starting from 2006-09-26 and continues to 2006-09-27, but this spike isn’t that significant if we consider the overall traffic pattern of the machine.
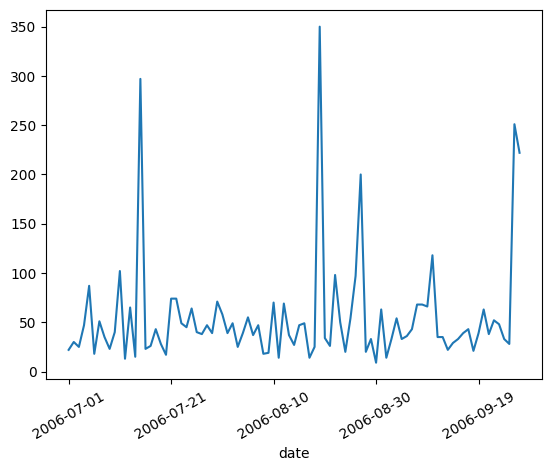
Machine 6 - Detected Compromise Date: 2006-09-26
We can see a spike around the time of compromise in the chart, similar to machine 3 which is supposedly compromised on the same day. But the spike on this machine happens on 2006-09-25, the day before the detected compromise, and there’s no spike during the day of compromise.
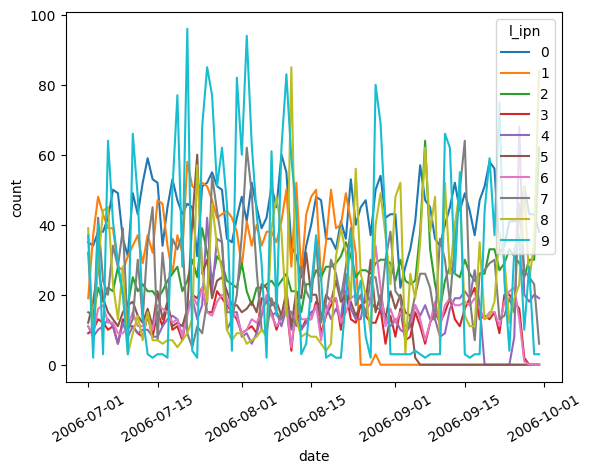
Daily Connected Peers
The following figure shows how many r_asn peers each machine is connected to every day during the monitoring period.
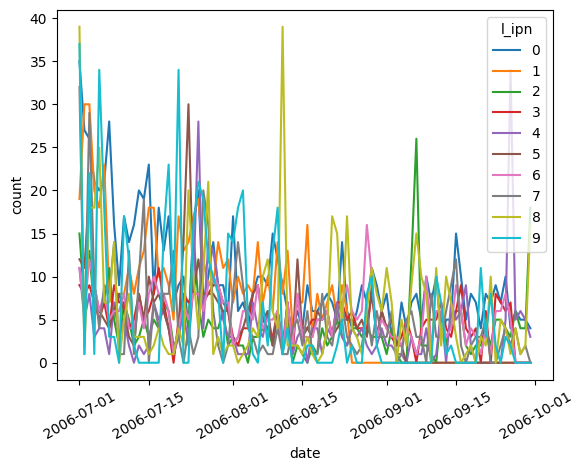
The following figure shows how many new r_asn peers each machine is connected to for the first time every day during the monitoring period.
The following is the list of r_asn the compromised machines were connecting to for the first time on their day of detected compromise.
| Date | Machine | Peers |
|---|---|---|
| 2006-08-24 | 1 | 1741, 4795, 6057, 6385, 17200, 39632 |
| 2006-09-04 | 5 | 6356, 13768 |
| 2006-09-18 | 4 | 6746, 16339 |
| 2006-09-26 | 3 | 9584, 11279, 15169, 17464, 17716, 29096, 33260 |
| 2006-09-26 | 6 | 8434, 11279, 17464, 29096, 33260 |
Among the r_asn peers connected with the compromised hosts for the first time on the table above, the following peers are closely associated to the compromised machines and doesn’t have any other machines outside the machines compromised on that exact date connected to them.
| Date | Machine | Peers |
|---|---|---|
| 2006-08-24 | 1 | 17200, 39632 |
| 2006-09-04 | 5 | - |
| 2006-09-18 | 4 | - |
| 2006-09-26 | 3 | 11279, 17716 |
| 2006-09-26 | 6 | 11279 |
Are those peers related to the compromise? We can’t say for sure, as we only have very limited information in our dataset.
Conclusion
As we mentioned earlier in this post, it’s pretty hard to tell if a machine is compromised just based on the information we’re given. But from what we see during the suspected day of compromise, given that we have access to the system logs of the machines and the network where the machines resided we might be able to trace it further to get the behavioral pattern of the machines outside their network traffic behavior, which doesn’t seem to be a good feature for us to determine if a machine is compromised in this case.
In order for us to be able to reliably detect a compromise, it’s necessary for us to define a more specific scope about the compromise. And since a compromise can be somewhat tricky to detect even with full system logs available in our disposal, I don’t think determining whether the machines in our dataset is compromised or not simply by the number ot network connections they made to certain ISPs is a good approach to the problem.
References
Department of Statistics - Stanford
Rule-based detection - Cybersecurity - Attack and Defense Strategies